Coronavirus Infection Forecast for Korea, Italy and Iran
Jian.Chen@
Abstract
Based on what we have learned from China (both inside Hubei, the epicenter of the coronavirus outbreak, and outside Hubei), we estimate the effectiveness of China’s containment policy, and corresponding model parameters. We make up three scenarios to utilize these parameters: S1 means the containment policy is as effective as China outside Hubei; S2 is close to Hubei experience, and about 75% of S1’s effectiveness;S3 is about 56% of S1’s effectiveness.
Under these three scenarios, we forecast the peak of daily incremental infection cases, the peak date, and the number of total infection cases at end of March, April, and May for these three countries: Korea, Italy, and Iran.
|
Korea: Forecast |
S1 |
S2 |
S3 |
|
Peak Value of Incremental Confirmed Cases |
444 |
484 |
610 |
|
Peak Value Date |
2020/3/6 |
2020/3/8 |
2020/3/12 |
|
Confirmed Cases at March End |
9,450 |
11,485 |
17,501 |
|
Confirmed Cases at April End |
9,454 |
11,546 |
21,326 |
|
Confirmed Cases at May End |
9,454 |
11,547 |
22,192 |
|
Italy: Forecast |
S1 |
S2 |
S3 |
|
Peak Value of Incremental Confirmed Cases |
776 |
918 |
1,183 |
|
Peak Value Date |
2020/3/10 |
2020/3/12 |
2020/3/15 |
|
Confirmed Cases at March End |
12,114 |
16,454 |
26,567 |
|
Confirmed Cases at April End |
12,134 |
16,691 |
35,182 |
|
Confirmed Cases at May End |
12,134 |
16,691 |
37,131 |
|
Iran: Forecast |
S1 |
S2 |
S3 |
|
Peak Value of Incremental Confirmed Cases |
1,223 |
2,374 |
7,230 |
|
Peak Value Date |
2020/3/12 |
2020/3/17 |
2020/3/23 |
|
Confirmed Cases at March End |
19,439 |
42,062 |
126,978 |
|
Confirmed Cases at April End |
19,512 |
43,771 |
208,006 |
|
Confirmed Cases at May End |
19,512 |
43,775 |
226,340 |
Introduction of Models
We built a transition matrix model for CoVID-19 as the following.
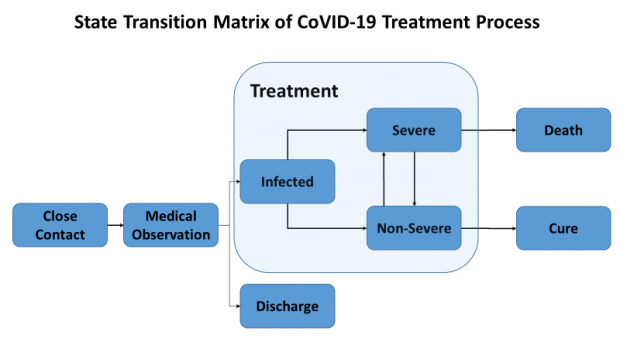
The detailed mathematics for the model can be found at the pre-print journal medRxiv web site: . This paper has also been submitted to Lancet.
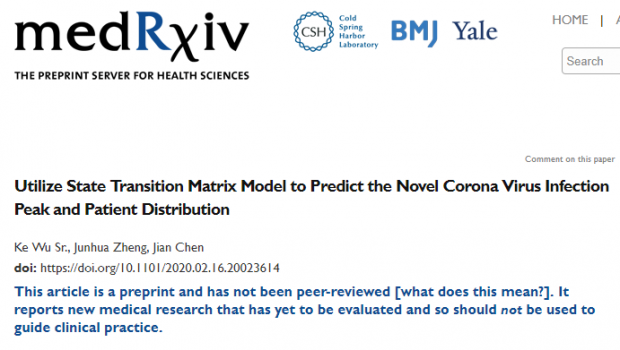
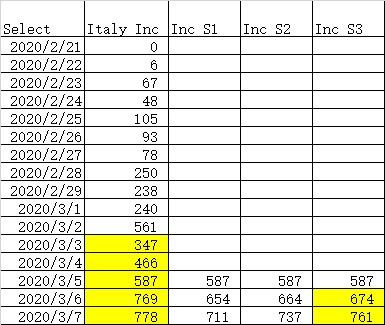
Based on the last month’s actual data, we performed a back-testing of the forecast model. The results are very promising, regarding the forecast of peak estimate and peak date. The model proves to be reasonable, robust, and accurate. The treatment team is Wuhan also find it very useful. As a matter of fact, one of the co-authors, Dr. Zheng Junhua, is the team leader of Shanghai’s medical team in Wuhan.

Based on last month’s actual data, we find the key driver, NCC Decay Rate, is reduced to a level below zero very fast, which means less people are added to the new close contact list every day.
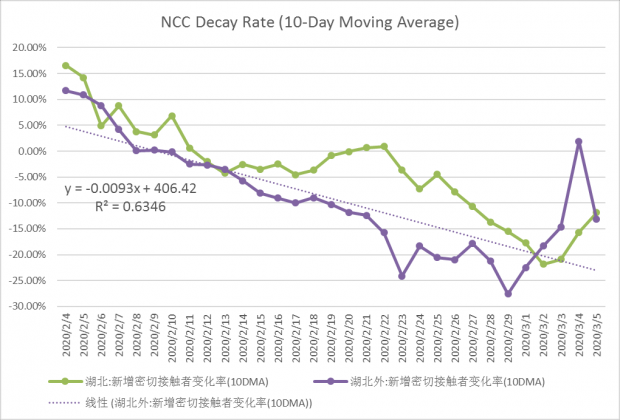
As a result, the new confirmed case (NCC) decay rate is also quickly reduced below zero, which means there’s less new infection cases (NCF) every day. We estimate the daily reduction rate is -2.65% for outside Hubei regions, and -2.20% inside Hubei. However, the rate does seem to have a floor: -30% for outside Hubei, and -20% for inside Hubei.
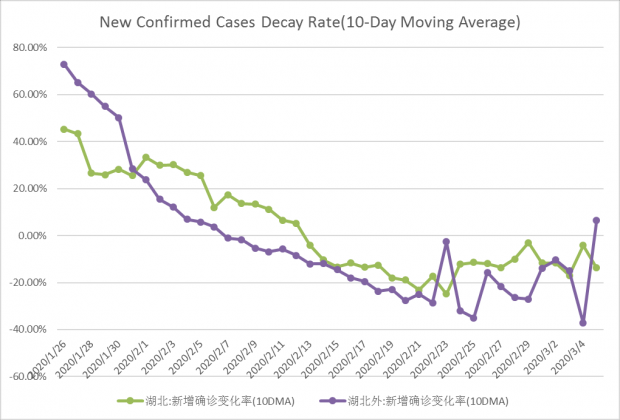
Thus, we set up three scenarios as the following:
|
|
S1 |
S2 |
S3 |
|
Description |
100% of containment policy effectiveness as outside Hubei |
75% of containment policy effectiveness as outside Hubei |
56% of containment policy effectiveness as outside Hubei |
|
Min NCF inc% |
-30% |
-20% |
-5% |
|
daily NCF inc% |
-2.65% |
-2.00% |
-1.50% |
And then we carry out model forecast for these three countries: Korea, Italy, Iran.
Korea Forecast
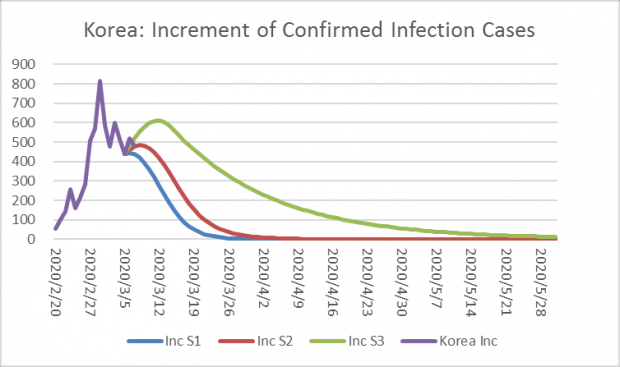
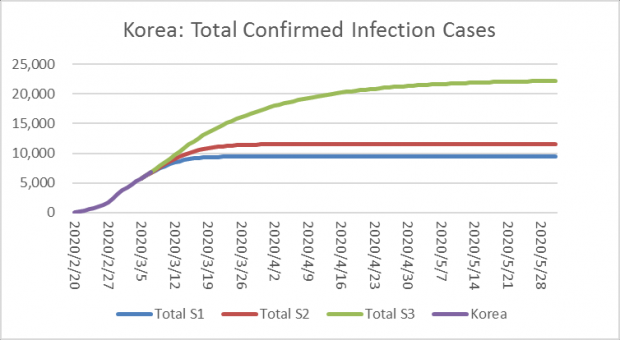
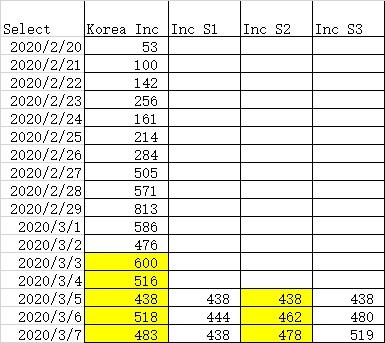
Based on last two day’s back test, Korea is close to S1-S2.
Italy Forecast
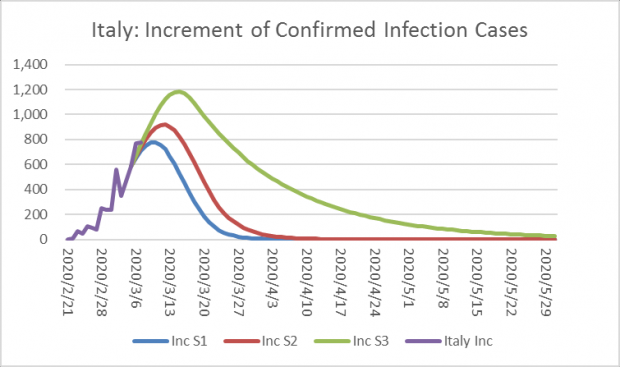
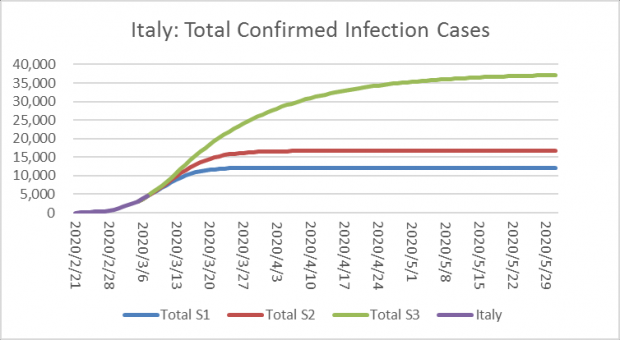
Based on the last two days’ back test, Italy is close to S3.
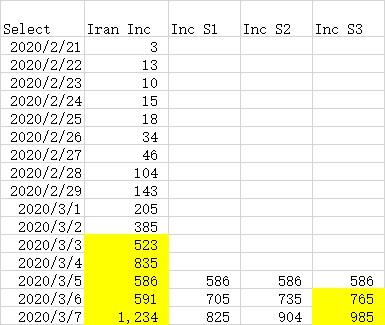
Iran Forecast
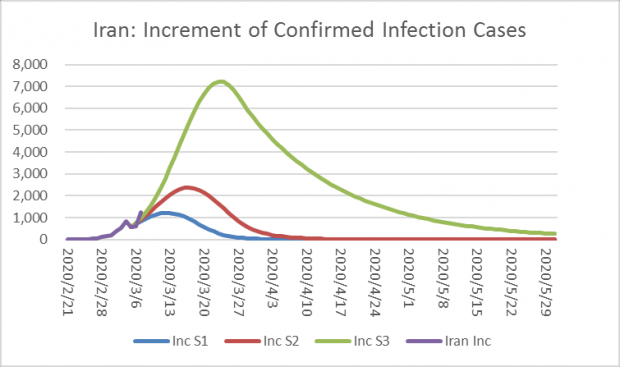
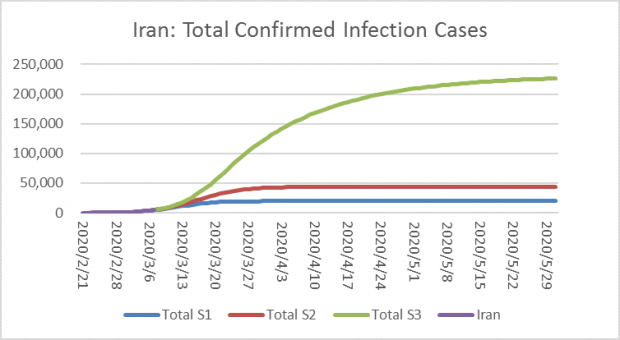
Based on the last two days’ back test, Iran is close to S3.
Conclusion
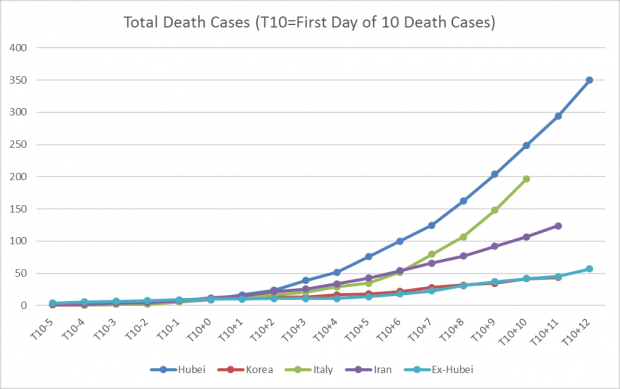
Based on the model forecast, and recent trends, we expect Korea to contain the coronavirus outbreak relatively quickly, while Italy and Iran need to improve the effectiveness of their containment policy. The trend is also illustrated by the total death toll number, while Korea is very similar to ex-Hubei region, Italy and Iran’s death tolls will likely be much higher.
0
推荐


 京公网安备 11010502034662号